|
|
In this example, we examine the trap handler in the kernel that deals with page faults (trap type 14, or 0xe in hexadecimal; see the trap(M) manual page for a list of possible CPU exceptions).
> idt 0xe
iAPX386 IDT
CPU SLOT     SELECTOR OFFSET   TYPE       DPL  ACCESSBITS
  0   14         0158 f0011080 TGATE386     0  CNT=0
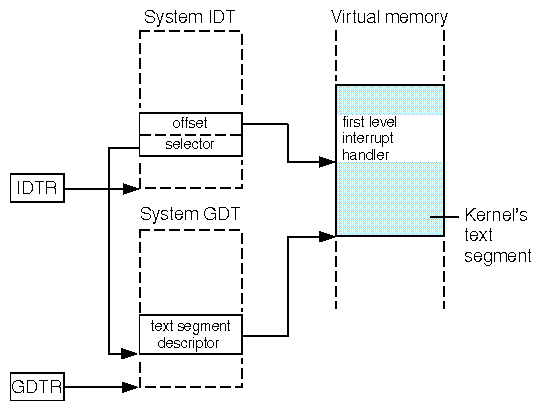
The displayed offset address, 0xf0011080 corresponds to the
virtual address of the trap handler. The slot in the
system GDT pointed to by the segment selector can be
obtained by right-shifting its value by 3 places (0x0158 >> 3).
This gives slot 43 in the GDT which describes
the kernel's text segment.
``How an Interrupt Descriptor Table entry indexes the first level interrupt handler in the kernel's text segment''
illustrates how the offset point to the first level interrupt
handler in the kernel's text segment.
> dis 0xf0011080 2
pftrap              pushl  $0xe
pftrap+0x2          jmp    0xfffff0f1 <0xf0010178>   [cmntrap]
The handler routine pftrap calls the common trap
handler routine cmntrap; this can be disassembled
by specifying its symbolic name to dis:
> dis cmntrap 6
cmntrap             pushal
cmntrap+0x1         pushl  %ds
cmntrap+0x2         pushl  %es
cmntrap+0x3         pushl  %fs
cmntrap+0x4         pushl  %gs
cmntrap+0x5         pushfl

How an Interrupt Descriptor Table entry indexes the first level interrupt handler in the kernel's text segment