|
|
From the SNMP Agent Manager's Stats menu, you can view SNMP statistics generated by the snmpstat(ADMN) command. You can select:
These statistics displays will, by default, show system and network names. To show numbers instead, select Display Mode from the Stats menu and select numeric.
You can also view these statistics from the command line by
using snmpstat with the options shown above. Its complete
syntax is:
snmpstat [options] [node] [community]
If you specify a community, you must also specify a node name. If no community argument is specified, the default community of public is used.
See also:
The SNMP Agent Manager's main screen displays the current system group status. You can also display this information by using snmpstat(ADMN).
The following is an example of using snmpstat with the -s option to retrieve the system group.
snmpstat system group example
# snmpstat -s paris publicsnmpstat takes care of formatting the information in a way that is easier to understand. For example, snmpstat converts the raw clock ticks of the agent uptime into hours, minutes, seconds, and hundredths of a second.System Group Description: SNMPD Version 3.0 for SCO UNIX ObjectID: SCO.1.0 UpTime: 1 hour, 1 minute, 40 seconds, 95 hundredths Contact: Trevor Jones x256 Name: paris.cities.your_company.com Location: First Floor Computer Room Services: applications, end-to-end
See also:
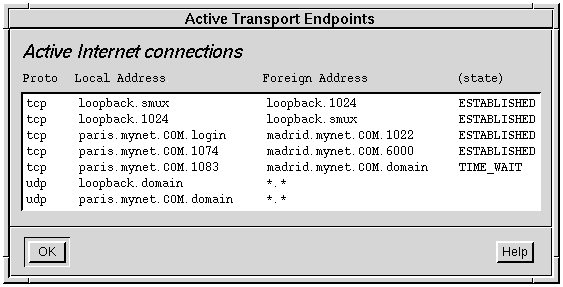
You can view a list of active endpoints by selecting Active Endpoints from the SNMP Agent Manager's Stats menu:

The display shows:
See also:
You can see all active Internet connections for different services by selecting Transport Table from the SNMP Agent Manager's Stats menu:
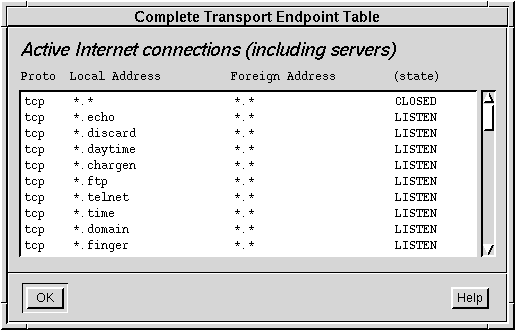
The display shows:
You can also use snmpstat(ADMN) with the -t option to view this information.
See also:
You can view the routing table by clicking on Routing Table in the SNMP Agent Manager's Stats menu:
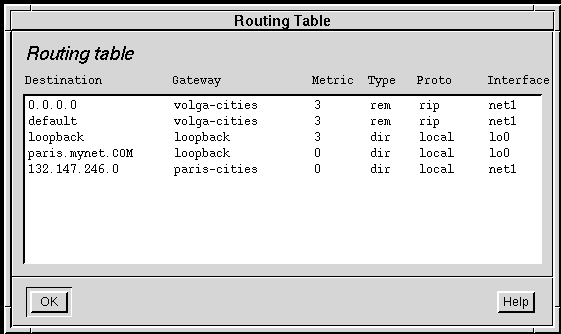
The display shows:
In the example shown, five routes are shown for the system paris. Three of them are directly attached. These are the routes for loopback, the local system, and the cities subnet. Two others have been acquired by the RIP routing protocol from the host volga-cities.
You can also obtain this information by using snmpstat(ADMN) with the -r option.
See also:
You can view address translations of sites with which SNMP recently communicated. From the SNMP Agent Manager's Stats menu, click on Address Table:
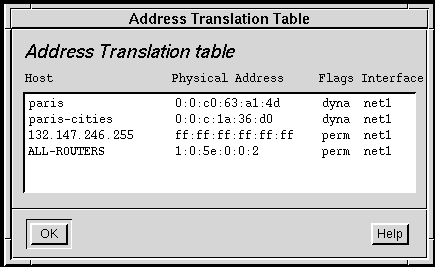
The display shows:
You can also obtain this information by using
snmpstat(ADMN)
with the -a option.
You can view cumulative statistics for active interfaces. From the SNMP Agent Manager's Stats menu, click on Active Interfaces:
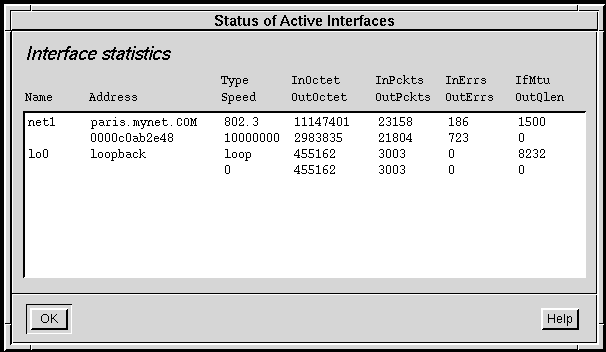
The display shows:
You can also obtain this information by using
snmpstat(ADMN)
with the -i option.
You can view all SNMP objects from the SNMP Agent Manager's Stats menu by clicking on SNMP Statistics:
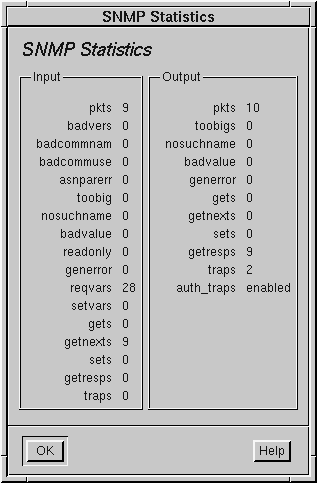
You can also obtain this information by using
snmpstat(ADMN)
with the -S option.
See also: